Visualizations
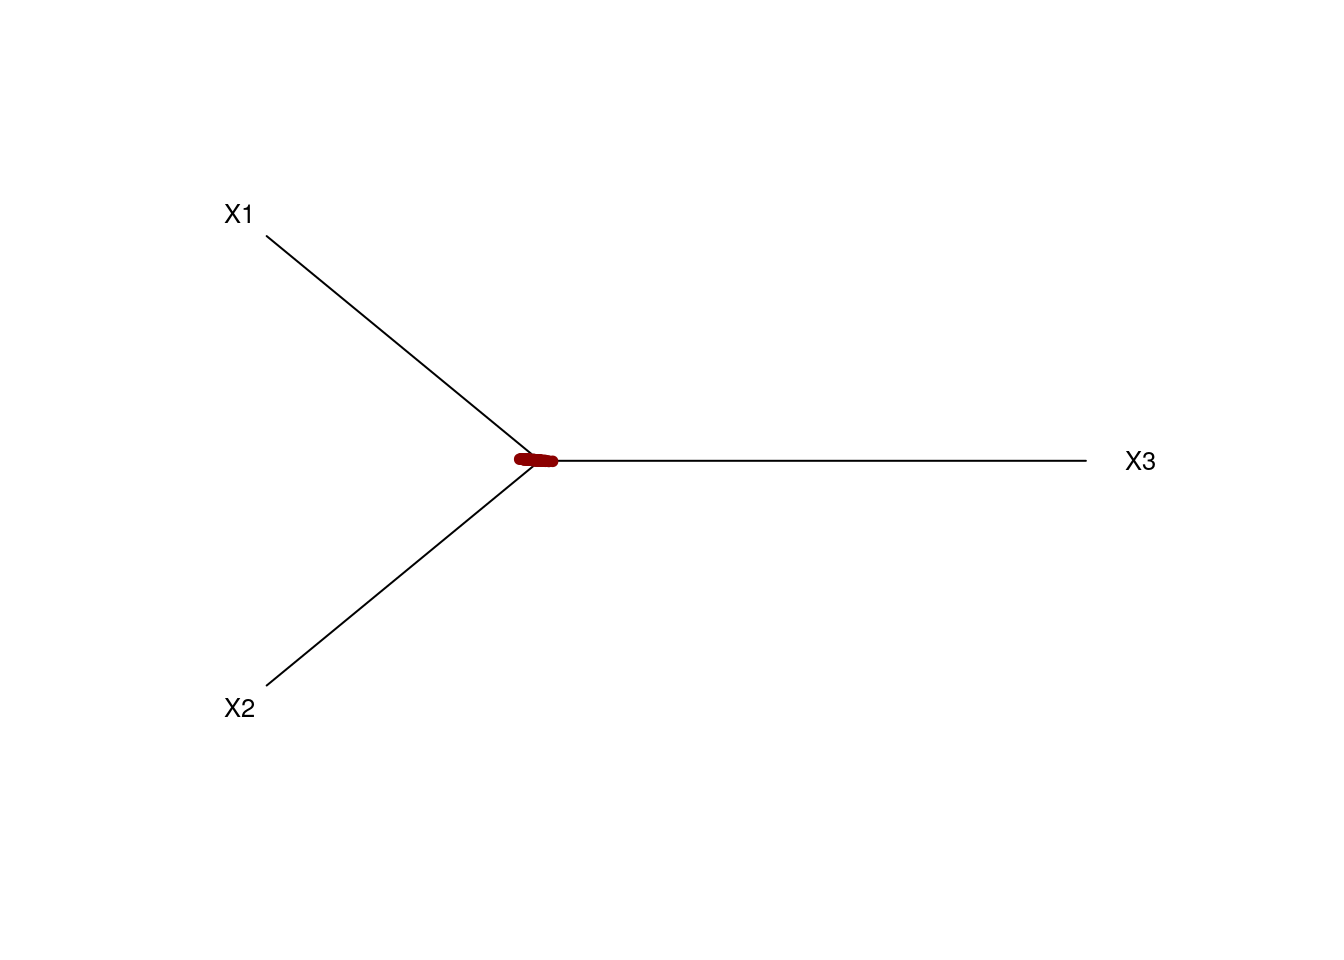
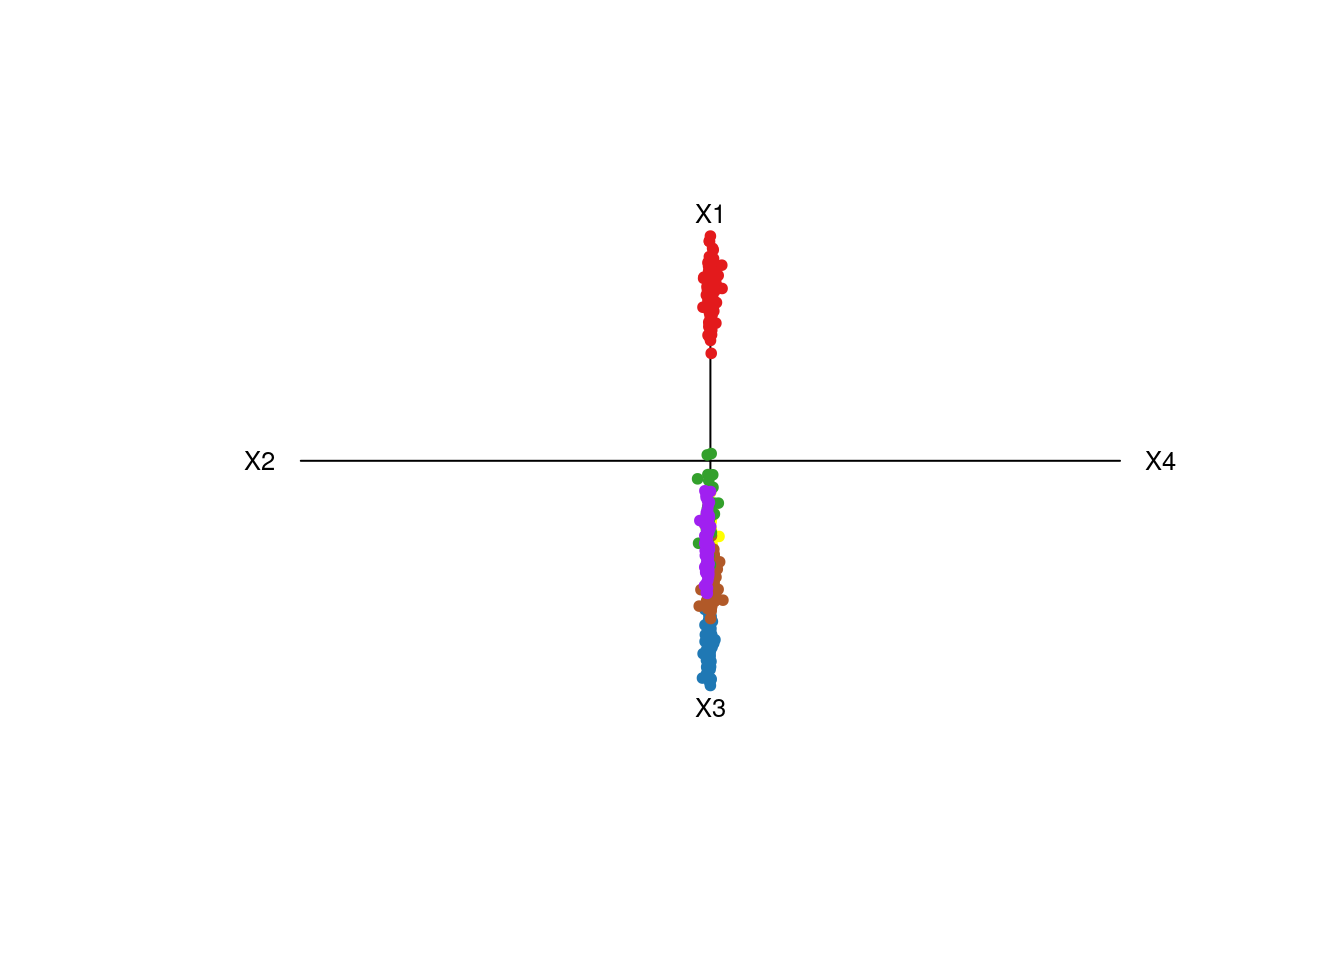
We display visualizations using Radviz3d, Viz3D, 3D UMAP, 3D tSNE and Star coordinate plots with OLDA and ULDA for simulated datasets and real datasets.
Simulated Datasets
Overlap of simulated groups
## [,1] [,2] [,3] [,4] [,5]
## [1,] 1.000000e+00 1.639895e-04 3.182632e-05 1.798221e-04 2.205202e-04
## [2,] 1.639895e-04 1.000000e+00 2.532816e-05 4.463230e-05 6.468964e-05
## [3,] 3.182632e-05 2.532816e-05 1.000000e+00 8.213254e-06 4.027518e-05
## [4,] 1.798221e-04 4.463230e-05 8.213254e-06 1.000000e+00 7.275133e-05
## [5,] 2.205202e-04 6.468964e-05 4.027518e-05 7.275133e-05 1.000000e+00
## [,1] [,2] [,3] [,4] [,5]
## [1,] 1.0000000000 0.0018245417 0.0005198596 0.0009900744 0.0010713403
## [2,] 0.0018245417 1.0000000000 0.0007913029 0.0001353604 0.0010634643
## [3,] 0.0005198596 0.0007913029 1.0000000000 0.0006378955 0.0022492259
## [4,] 0.0009900744 0.0001353604 0.0006378955 1.0000000000 0.0001373052
## [5,] 0.0010713403 0.0010634643 0.0022492259 0.0001373052 1.0000000000
## [,1] [,2] [,3] [,4] [,5]
## [1,] 1.000000000 0.007264116 0.007370374 0.012466875 0.005986071
## [2,] 0.007264116 1.000000000 0.005624748 0.015194218 0.015208090
## [3,] 0.007370374 0.005624748 1.000000000 0.009914756 0.008665576
## [4,] 0.012466875 0.015194218 0.009914756 1.000000000 0.010302230
## [5,] 0.005986071 0.015208090 0.008665576 0.010302230 1.000000000
## [,1] [,2] [,3] [,4] [,5]
## [1,] 1.00000000 0.04381444 0.04474195 0.05224307 0.02608161
## [2,] 0.04381444 1.00000000 0.05388159 0.09802665 0.04805296
## [3,] 0.04474195 0.05388159 1.00000000 0.04209911 0.03580285
## [4,] 0.05224307 0.09802665 0.04209911 1.00000000 0.03996085
## [5,] 0.02608161 0.04805296 0.03580285 0.03996085 1.00000000
## [,1] [,2] [,3] [,4] [,5]
## [1,] 1.0000000 0.2875031 0.2057802 0.2257169 0.2047143
## [2,] 0.2875031 1.0000000 0.2561648 0.2633662 0.2873042
## [3,] 0.2057802 0.2561648 1.0000000 0.2294935 0.3153589
## [4,] 0.2257169 0.2633662 0.2294935 1.0000000 0.2168708
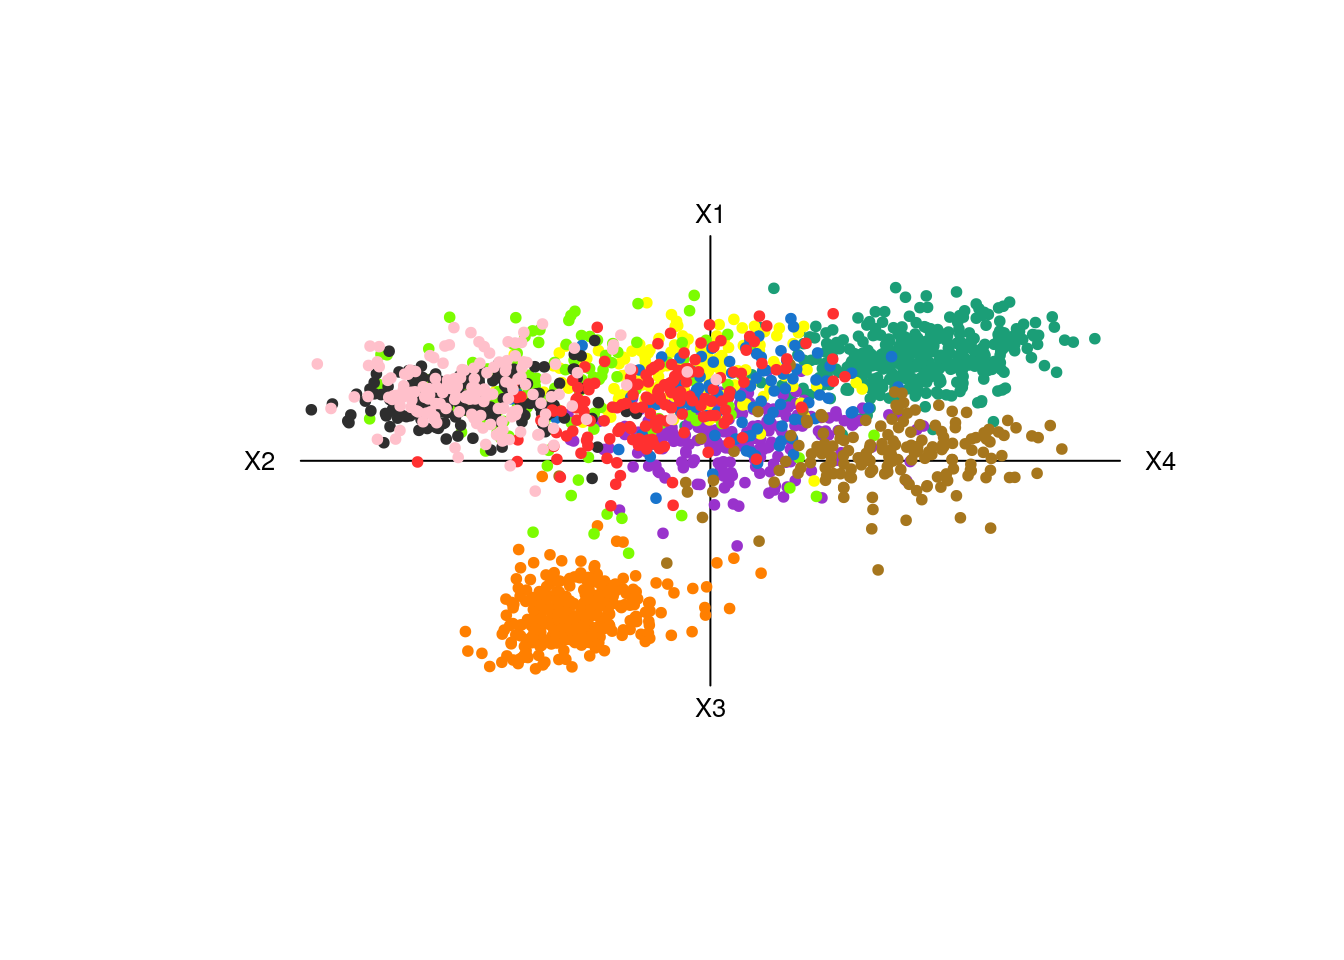
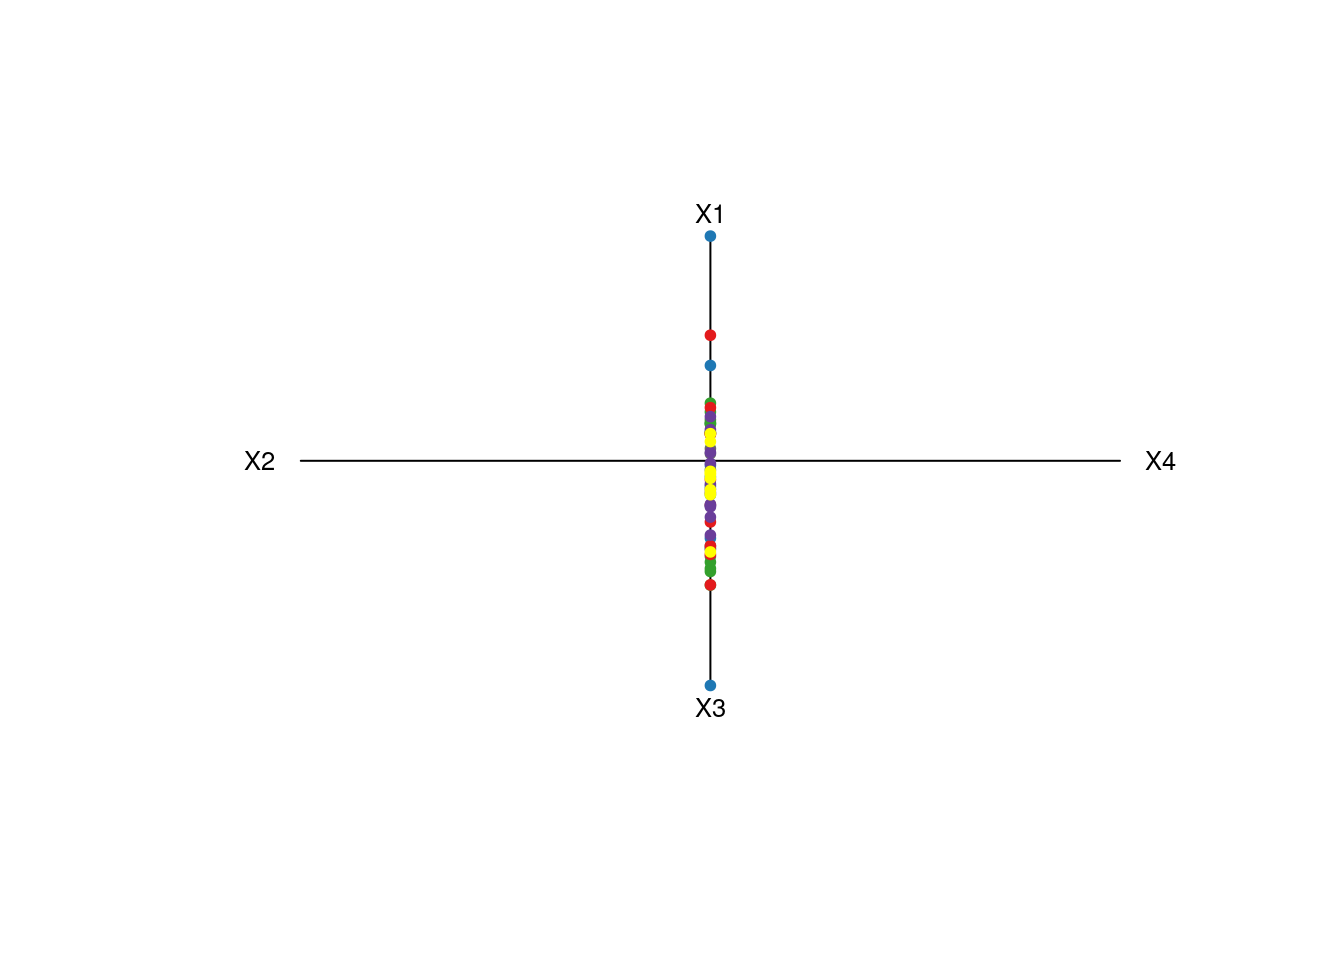
## [5,] 0.2047143 0.2873042 0.3153589 0.2168708 1.0000000Fig. S1: UMAP and RadViz3D of 100D MixSim Simulated Datasets
Real Datasets
Fig. S2: Gamma Ray Burst Dataset
|
(a) t-SNE |
(b) UMAP |
 (c) Star Coordinates with OLDA |
 (d) Star Coordinates with ULDA |
|
(e) Viz3D |
(f) RadViz3D |
Fig. S3: Zipcode Digits Dataset
|
(a) t-SNE |
(b) UMAP | |
 (c) Star Coordinates with OLDA |
 (d) Star Coordinates with ULDA |
|
|
(e) Viz3D |
(f) RadViz3D |
Fig. S4: Faces
|
(a) t-SNE |
(b) UMAP |
 (c) Star Coordinates with OLDA |
 (d) Star Coordinates with ULDA |
|
(e) Viz3D |
(f) RadViz3D |
Fig. S5: Suicide Ideation
|
(a) t-SNE |
(b) UMAP |
|
(c) Viz3D |
(d) RadViz3D |
Fig. S6: Voting Records of US Senators (Senators Dataset)
|
(a) t-SNE |
(b) UMAP |
 (c) Star Coordinates with OLDA |
 (d) Star Coordinates with ULDA |
|
(e) Viz3D |
(f) RadViz3D |
Fig. S7: Autism Spectrum Disorder (ASD) Screening (Autisim Dataset)
|
(a) t-SNE |
(b) UMAP |
 (c) Star Coordinates with OLDA |
 (d) Star Coordinates with ULDA |
|
(e) Viz3D |
(f) RadViz3D |
Fig. S8: SPECT Heart Datset
|
(a) t-SNE |
(b) UMAP |
 (c) Star Coordinates with OLDA |
 (d) Star Coordinates with ULDA |
|
(e) Viz3D |
(f) RadViz3D |
Fig. S8: Indic scripts (Script Dataset, 6 groups)
|
(a) t-SNE |
(b) UMAP |
 (c) Star Coordinates with OLDA |
 (d) Star Coordinates with ULDA |
|
(e) Viz3D |
(f) RadViz3D |
Fig. S9: RNA sequences of human tissues (Gtex Dataset)
|
(a) t-SNE |
(b) UMAP |
|
(c) Viz3D |
(d) RadViz3D |